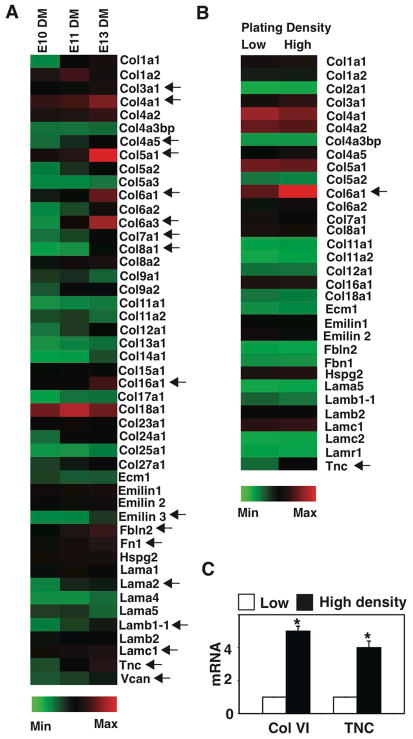
Figure 2. Transcriptional profiling of ECM components.
(A) Transcriptional profiling of ECM components expressed in DM at E10, 11 and 13 (all gene-profiling results are normalized to GAPDH levels). Arrows indicate ECMs that are expressed >2-fold higher in the DM at E13 compared with E10. (B) Transcriptional profiling of ECM components expressed in DM cells that are plated on FN islands at low or high plating density for 16 h. Arrows indicate ECMs that are expressed >2-fold higher in the DM, plated at a high density compared with the one plated at a low density. (C) Graph showing induction of collagen VI and TNC in mesenchymal cells cultured under the same conditions as in Fig. 1D.

