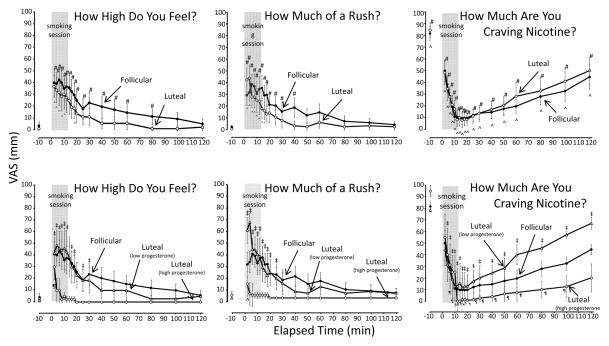
Figure 3.
Mean (± SE) ratings of High, Rush, and Craving for Nicotine after smoking high-nicotine cigarettes during the follicular and luteal phases of the menstrual cycle. The three graphs above depict the follicular phase in comparison with the luteal phase; the three graphs below depict the follicular phase in comparison with the two luteal phase subgroups (high progesterone and low progesterone). The 12-min cigarette smoking period is indicated by a gray rectangle. Significant changes (p < 0.05) from the presmoking baseline in follicular phase group are indicated by #; in luteal phase group by ^; in the high progesterone luteal phase subgroup by ‡; and in the low progesterone luteal phase subgroup by ¶.

