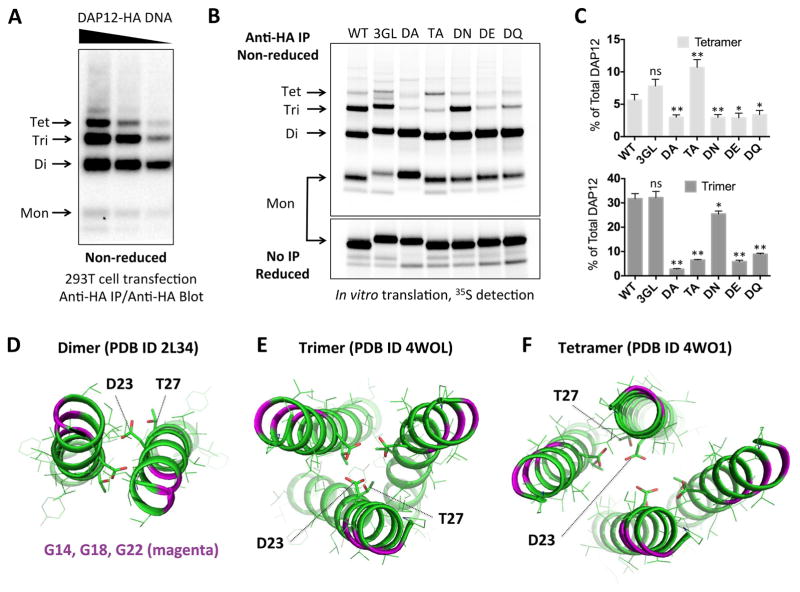
Figure 4. Correspondence of cellular DAP12 products with experimentally determined structures.
(A) HA-tagged human DAP12 was transiently transfected into 293T cells using serial dilutions of plasmid DNA. Cells were lysed 48 hours later in RIPA buffer and total DAP12 was immunoprecipitated using mouse anti-HA mAb. Recovered products were separated by non-reducing SDS-PAGE and immunoblotted using biotinylated rat anti-HA Fab with streptavidin-peroxidase. (B) HA-tagged human DAP12 was in vitro-translated in the presence of ER microsomes and 35S-methionine/cysteine and allowed to assemble for one hour. The ER membrane fraction was extracted in 0.5% digitonin and immunoprecipitated with anti-HA mAb. Recovered products were separated by non-reducing SDS-PAGE and visualized using a phosphorimager. Sequences were wild-type (WT), triple glycine-to-leucine (3GL), threonine-to-alanine (TA) and aspartic acid-to-alanine (DA), asparagine (DN), glutamic acid (DE) or glutamine (DQ). Half of the samples were run reduced with no IP to show equal total DAP12 signal (lower panel). (C) Quantitation of tetramer (top) and trimer (bottom) products expressed as % of total DAP12 signal in the non-reducing lanes for each mutant. Bar graphs show the mean ± standard deviation for three independent experiments. Statistical significance in unpaired t-test comparing each mutant to WT is indicated by ns (not significant), * (p<0.05) or ** (p< 0.01). (D–F) Structures of DAP12 complexes solved by solution NMR (dimer, panel D) and crystallography (trimer, panel E; tetramer, panel F). Glycines are shown in magenta ribbons, aspartic acid and threonines are shown in stick representation.

