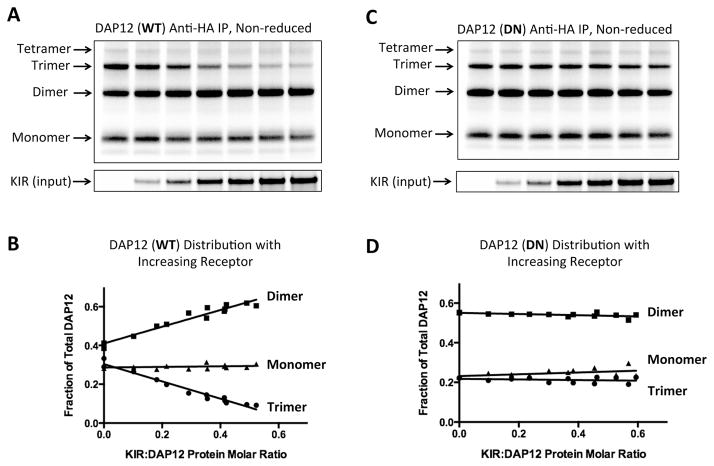
Figure 5. DAP12 oligomer formation and receptor assembly in the ER.
DAP12-WT (A and B) or DN mutant (C and D) mRNA (150 ng per reaction) was distributed equally among seven assembly reactions containing increasing amounts of KIR-pLeu mRNA (0–900 ng). After a 2-hour assembly period, 25% of the ER fraction was run on a reducing SDS-PAGE gel to determine input receptor amounts (lower panel). The remaining ER fraction was boiled in 0.5% SDS to dissociate non-covalent DAP12-KIR complexes and diluted 20-fold in RIPA solution to allow antibody capture. DAP12 products were isolated by anti-HA IP and separated by non-reducing SDS-PAGE. (B and D) Monomeric, dimeric and trimeric DAP12 products were quantitated by densitometry and the proportion of each was plotted as a function of KIR:DAP12 protein molar ratio (measured from the input control gel and adjusted for number of methionine and cysteine labeling positions in each protein). The data for each plot were taken from two independent experiments, including the ones shown in (A) and (C), covering a range of KIR:DAP12 ratios.

