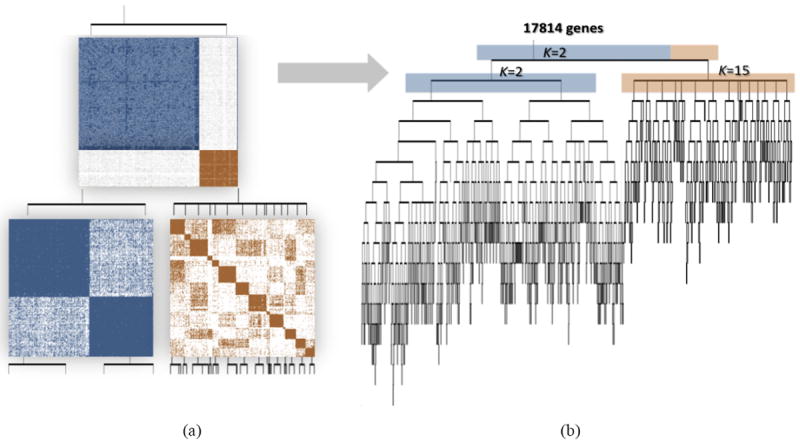
Fig. 2.

(a) Demonstration of the ReKS method on the GBM dataset at the first two iterations of K-means spectral decomposition recursions: two clusters are visible in the affinity map constructed from the entire dataset at the first level. From each, a new affinity matrix is constructed and spectral clustering repeated on the sub-affinity matrix. (b) Complete tree obtained by ReKS iterations. Each leaf node corresponds to a gene cluster in the final partition.
