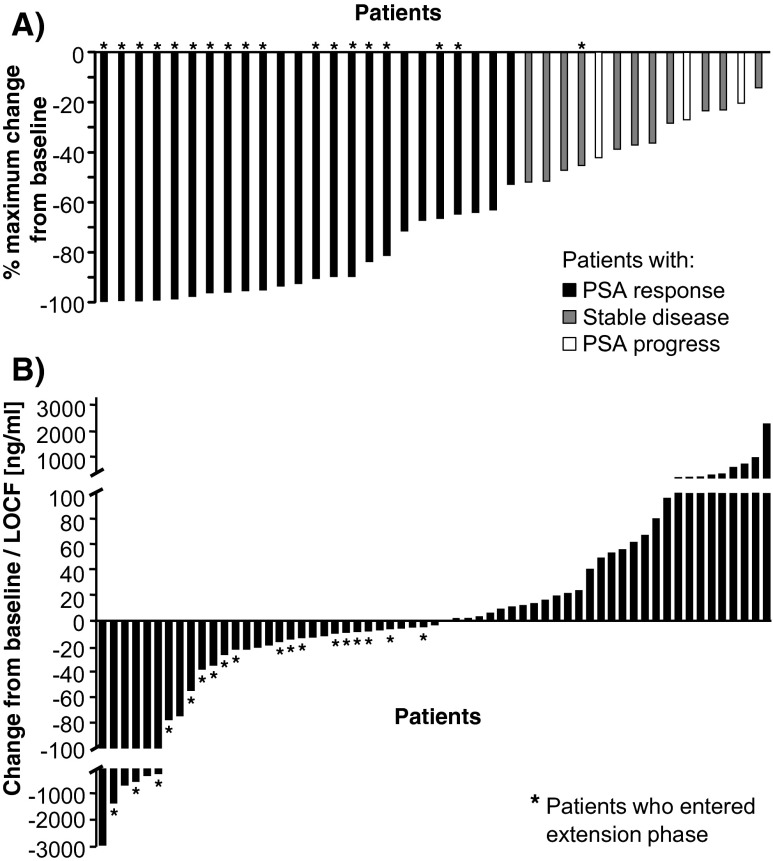
Fig. 3.
PSA change during therapy. a Maximal PSA reduction compared to baseline for patients with PSA response, with stable disease and PSA progress. b the PSA change from baseline or LOCF. Patients with PSA response: black bars, patients with stable disease: grey bars, patients with PSA progress: white bars. PSA Prostate-specific antigen, LOCF Last observation carried forward, *Patients who entered the expansion phase of the study

