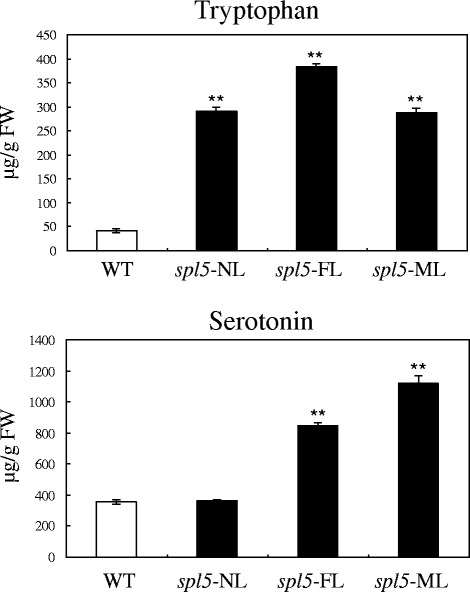
Figure 2.

In vivo tryptophan and serotonin levels by HPLC analysis. The tryptophan and serotonin concentrations are shown for the WT leaves and the spl5-NL, spl5-FL, and spl5-ML leaves, respectively. The significance of expression compared to WT with the P value less than 0.05 and 0.01 are marked by * and **, respectively.
