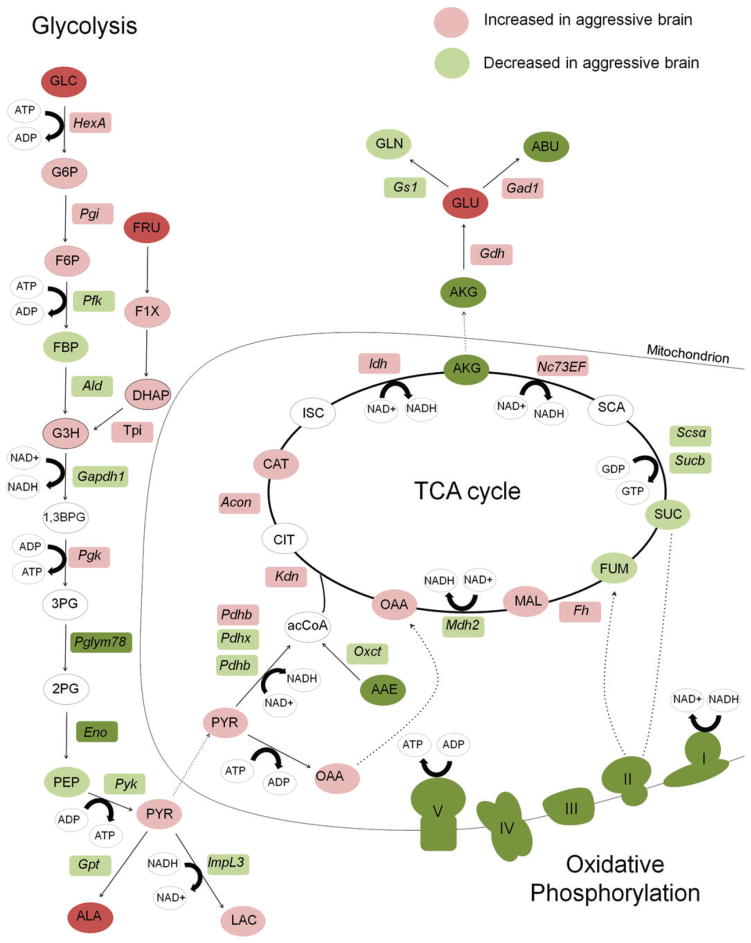
Figure 3. Relative levels of central metabolism metabolites and genes in the aggressive brain.
Metabolites are listed in circles and genes are in rectangles. Metabolites in white were not measured. Dark green and dark red colors represent changes in metabolites and mRNA that were statistically significant (a decrease or increase, respectively) according to gene expression and metabolite data from honey bees treated with alarm pheromone vs. control. Light green and light red colors represent a non-significant decrease or increase, respectively. Protein complexes in the oxidative phosphorylation pathway, which are composed of variable numbers of protein subunits, are drawn as cartoons that represent the physical shapes of the complexes. Complexes are colored green to represent the general down regulation of the transcripts that encode protein constituents. Circles with black and dotted borders were compounds that were indistinguishable from one another in the metabolomics analysis. GLC, glucose; PYR, pyruvate; OAA, oxaloacetate; CIT, citrate; AKG, alpha-ketoglutarate; SUC, succinate; FUM, fumarate; MAL, malate; SCA, succinyl-CoA; GLU, glutamate; GLN, glutamine; LAC, lactate; ALA, alanine; G6P, glucose 6 phosphate; F6P, fructose 6 phosphate; FBP, fructose 1,6 bis phosphate; GADP, glyceraldehyde 3 phosphate; DHAP, dihydroxyacetone phosphate; 1,3BPG, 1,3 bisphosphoglycerate; 3PG, 3 phosphoglycerate; 2PG, 2 phosphoglycerate; PEP, phosphoenolpyruvate.

