
Fig. 2.
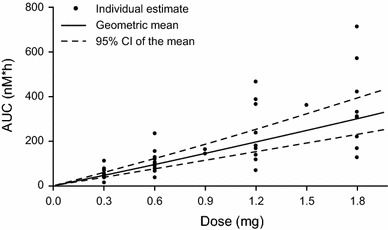
Dose proportionality test based on model-estimated AUC24, which, in turn, was derived from estimated CL/F. Solid line represents geometric mean AUC24, as estimated by the linear mixed-effects model of log (AUC24) versus log (dose). Model-derived AUC24 slope: 1.05 [0.96–1.15]95 % CI. AUC area under the plasma–concentration time curve, AUC 24 AUC from zero to 24 h, CL/F apparent clearance, CI confidence interval