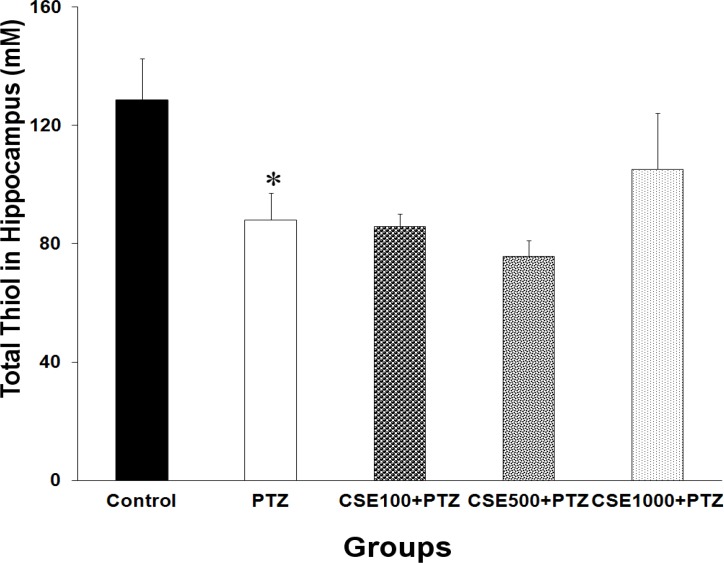
Figure 6.
Comparison of the total SH groups in hippocampal tissues of control, pentylenetetrazole (PTZ), C. sativum extract (CSE) 100 mg/kg (CSE 100)-PTZ, CSE 500 mg/kg (CSE 500)-PTZ, CSE 1000 mg/kg (CSE 1000)-PTZ groups. The animals were treated with saline or CSE (100, 500 or 1000 mg/kg) before a single injection (90 mg/kg) of PTZ; The animals in control group received saline instead of PTZ; * P < 0.050 as compared to control group.

