Figure 3.

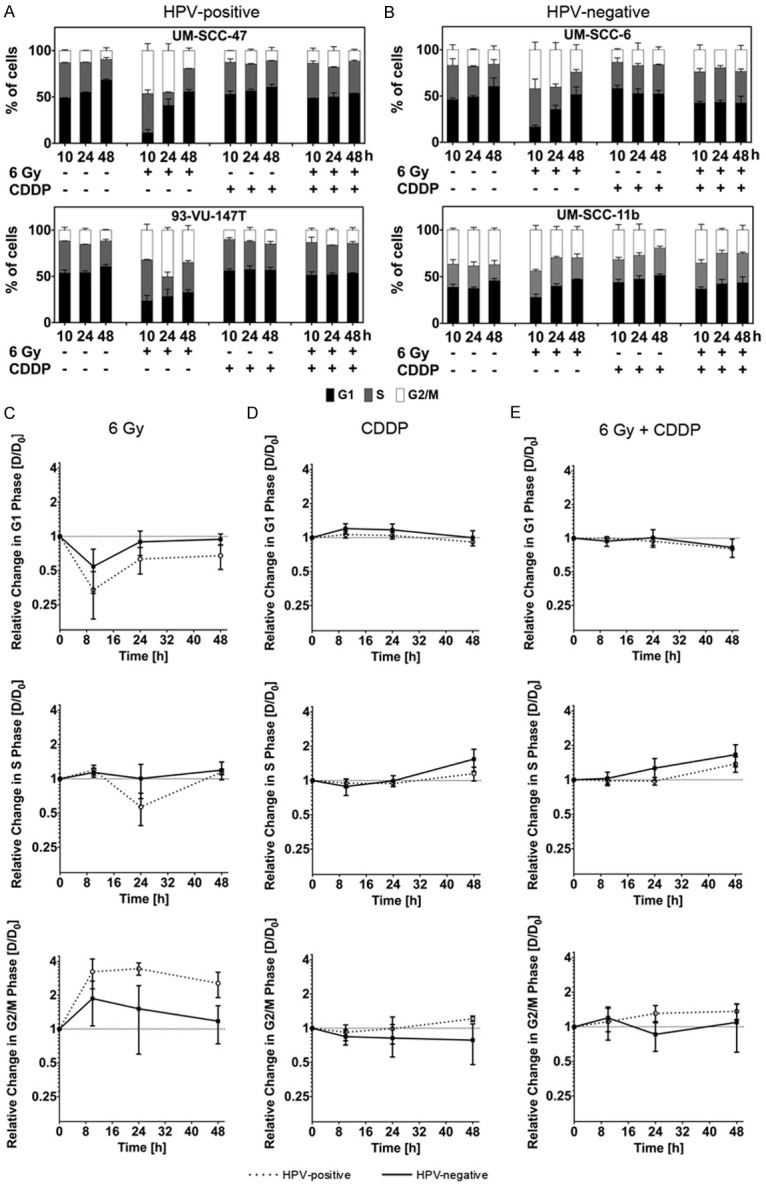
(A, B) Cell cycle progression in UM-SCC-47 and 93-VU147T cells (HPV+; A) and UM-SCC-6 and UM-SCC-11b cells (HPV-; B) 10-48 h after x-irradiation and/or incubation with Cisplatin (control: no treatment; G1 phase: black bar; S phase: grey bar; G2/M phase: white bar). (C-E) Grouped analysis of cells treated with x-irradiation (C) or Cisplatin-incubation (D), or x-irradiation and Cisplatin (E). Comparison of cell cycle alteration in HPV+ (spotted) and HPV- (black) cell lines. Figure shows relative changes in the proportion of cells in the G1, S, and G2/M phases (log2-scale).
