
Figure 7.
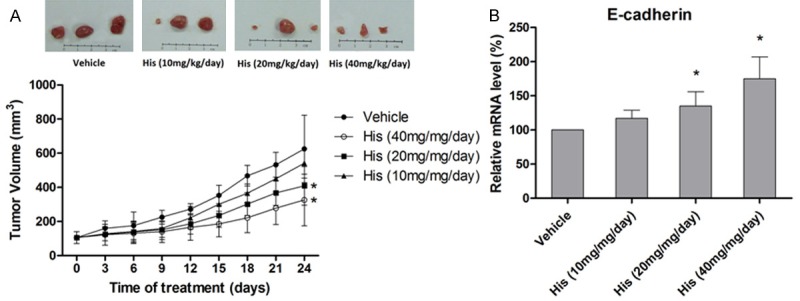
In vivo effect of hispidulin on E-cadherin expression. A. Tumors representing each of the experimental groups (n = 15 per group). Relative tumor volumes are expressed as mean ± SD. B. Effect of hispidulin on gene transcription of E-cadherin measured by qRT-PCR in the extracts of tumors. Data are presented as mean ± SD of three independent experiments. *P < 0.05 vs. vehicle.