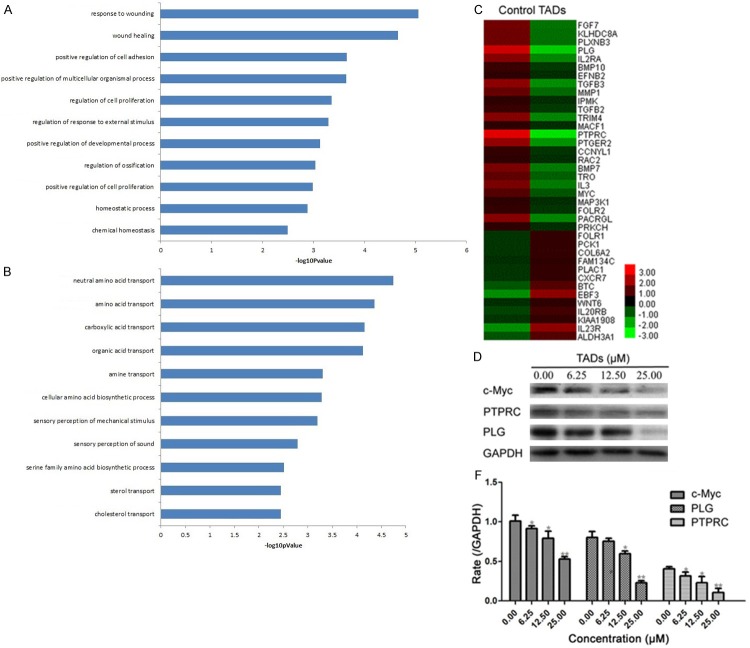
Figure 3.
The genetically different populations by TADs for SMMC-7721 cells. A: The GO category for the down-regulated genes in TADs group compared with control group. B: The GO category for the up-regulated genes in the TADs group compared with the control group. –logPvalue ≥ 2 was used as a cut-off threshold to select significant GO categories. The higher the enrichment, the more significant the biological processes. C: Hierarchical cluster analysis of 38 differentially down-regulated expressed genes for cell growth and apoptosis in samples. Each column represents one sample, and each gene was depicted by one row, where red denotes an increase in gene expression and green denotes a decrease in gene expression as compared with the other group. D: Comparison of c-Myc, PLG and PTPRC gene expression levels between control and TADs group by western blot, which confirmed the microarray analysis. Data were expressed as means ± SD (n = 3). *p < 0.05, **p < 0.01 vs. the control group.

