
Figure 2.
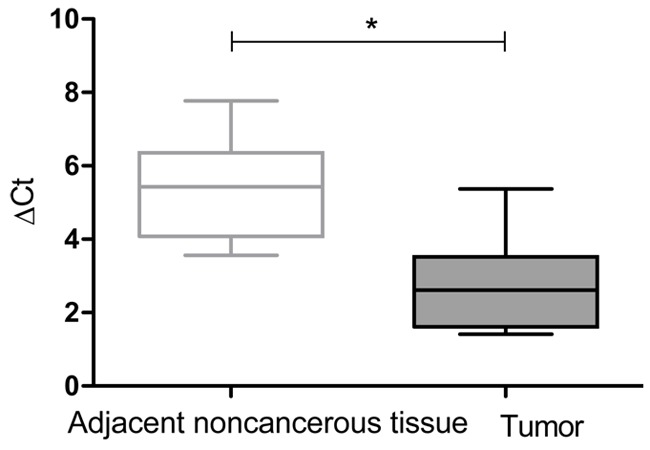
Real-time PCR analysis of MSI2 mRNA expression in 10 paired hepatocellular carcinoma samples and adjacent noncancerous tissues. For each sample, the relative MSI2 mRNA level was normalized using GAPDH expression. Data are presented as the median (line) ΔCt value with boxed 25th and 75th percentiles. The data range is represented by the upper and lower bars. *P < 0.01.