
Figure 6.
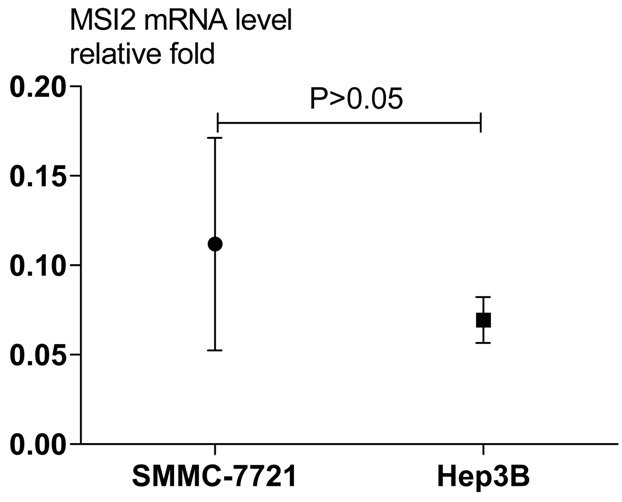
Real-time PCR analysis of MSI2 mRNA expression in HCC cell lines SMMC-7721 and Hep3B. The relative MSI2 mRNA level was normalized using GAPDH expression. The data range is represented by the upper and lower bars (P > 0.05).
Official websites use .gov
A
.gov website belongs to an official
government organization in the United States.
Secure .gov websites use HTTPS
A lock (
) or https:// means you've safely
connected to the .gov website. Share sensitive
information only on official, secure websites.
Real-time PCR analysis of MSI2 mRNA expression in HCC cell lines SMMC-7721 and Hep3B. The relative MSI2 mRNA level was normalized using GAPDH expression. The data range is represented by the upper and lower bars (P > 0.05).