
Figure 1.
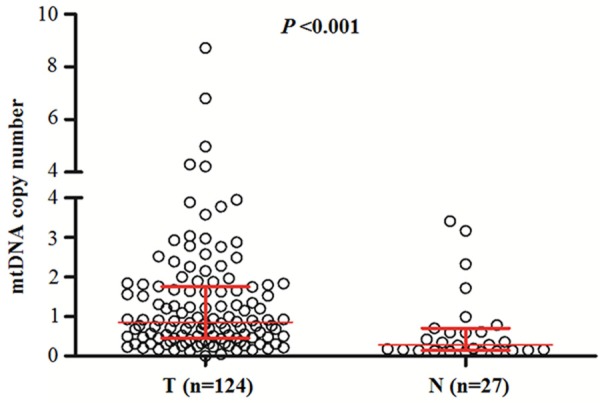
Copy number of mtDNA corresponding to each individual case of gliomas and non-neoplastic brain tissues (control subjects). A real-time quantitative PCR assay was performed to analyze mtDNA copy number in a cohort of gliomas and control subjects. The horizontal lines represent median ± interquartile range. T, tumor tissues; N, control subjects.