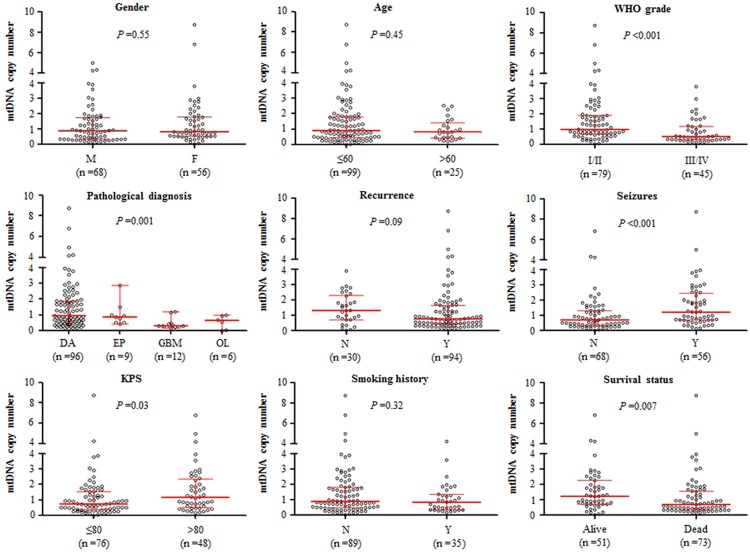
Figure 2.
Association of mtDNA copy number with clinicopathological characteristics in gliomas. Copy number of mtDNA was analyzed using real-time quantitative PCR approach. The circle represents mtDNA copy number of each glioma case. The horizontal lines represent median ± interquartile range. The sample medians were compared using the Mann-Whitney U test. M, male; F, female; DA, diffuseastrocytoma; EP, ependymoma; GBM, glioblastoma; OL, oligodendroglioma; N, No; Y, Yes; KPS, karnofsky performance status.

