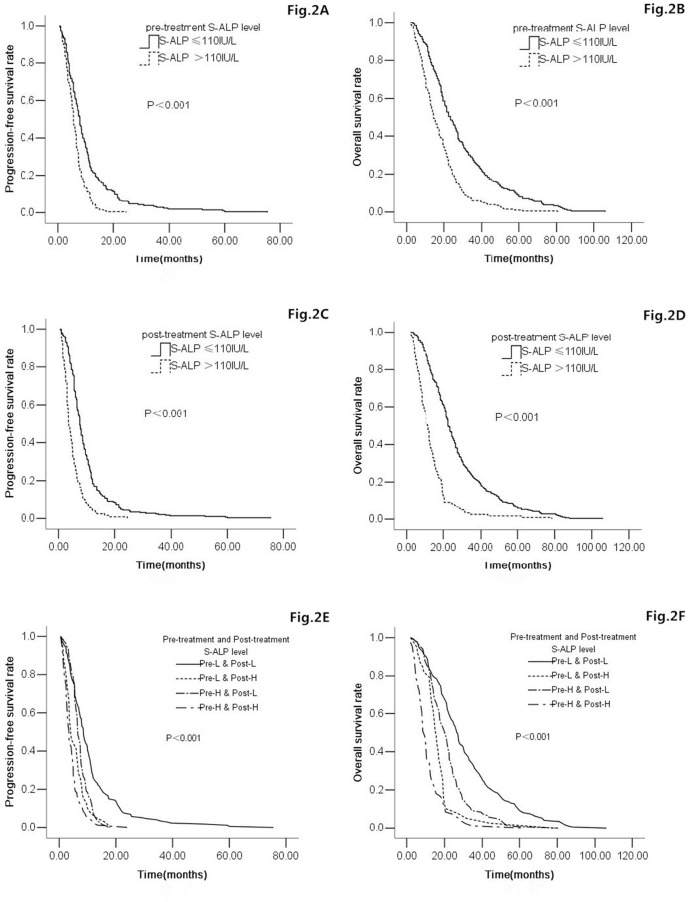
Figure 2.
Kaplan-Meier survival curves are shown for the total sample of 416 patients according to the pre-treatment (and post-treatment) S-ALP level. A) PFS according to the pre-treatment S-ALP (P<0.001). B) OS according to the pre-treatment S-ALP (P<0.001). C) PFS according to the post-treatment S-ALP (P<0.001). D) OS according to the post-treatment S-ALP (P<0.001). E) PFS according to the combination of pre-treatment and post-treatment S-ALP (P<0.001). F) OS according to the combination of pre-treatment and post-treatment S-ALP (P<0.001).

