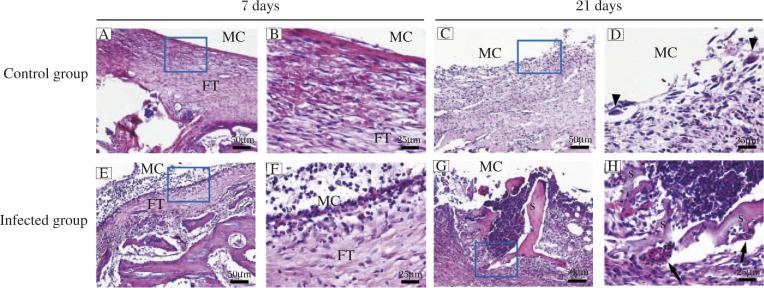
Fig. 1. H&E staining of operated knees from the control group (A–D) and infected group (E–H).
Magnification: 100× (A, C, E and G) and 400× (B, D, F and H). Black arrowheads indicate multinucleated giant cells. MC, medullary cavity. FT, fibrous tissue. Black arrows reveal neutrophil infiltration. S, sequestra formation.

