
Figure 2.
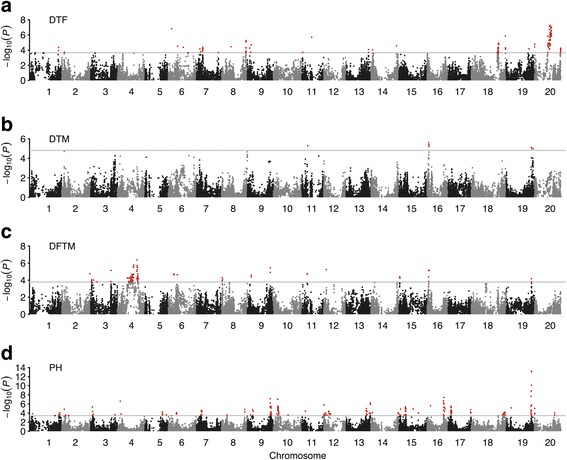
Manhattan plots of GWAS for each trait in soybean. Negative log10-transformed P values from a genome-wide scan by using mixed linear model (MLM) for days to flowering (DTF) (a), maturity (DTM) (b) and plant height (PH) (d), and compressed MLM for duration of flowering-to-maturity (DFTM) (c) are plotted against positions on each of the 20 chromosomes. The significant trait-associated SNPs (q < 0.05) are distinguished by the threshold line and are colored in red.