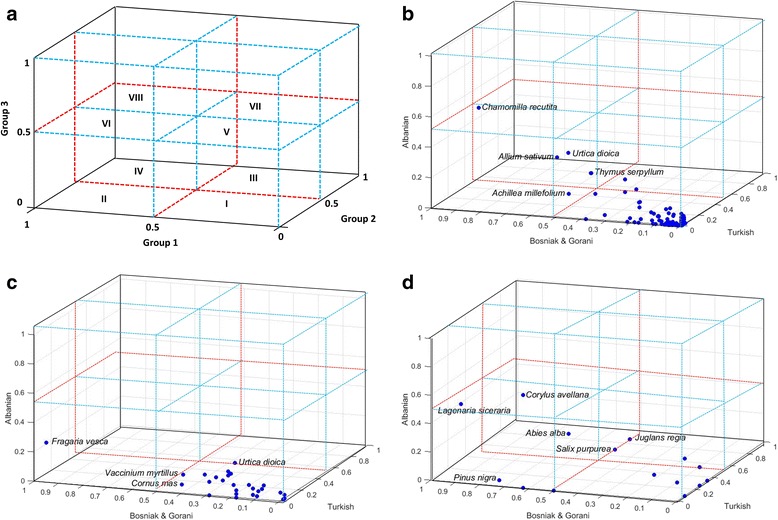
Figure 4.

Use-value matrix comparison of three groups with access to the same flora and ecological resources. a) Matrix design. Each quadrant corresponds to a specific relationship concerning the adjusted plant use-value (details provided in the methods). Adjusted use-values (UVadj) are represented for cited taxa by ethnic group and general category b) medicinal use, c) food use and d) handicraft use.
