
Figure 2.
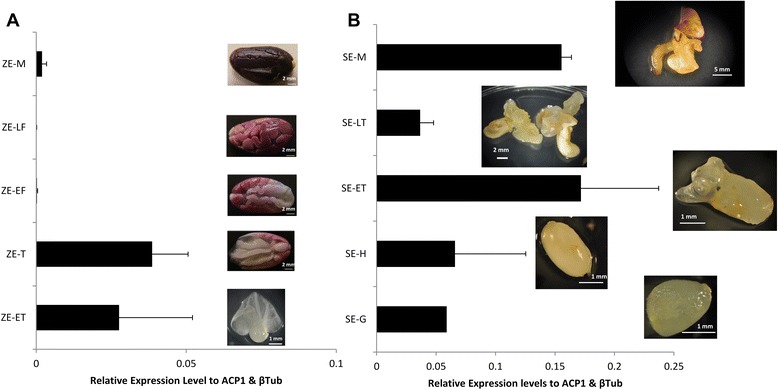
TcBBM expression throughout embryo development. Relative transcript expression of TcBBM throughout different development stages A. Zygotic embryogenesis and B. Somatic embryogenesis. Expression levels were analyzed by RT-qPCR and the TcBBM gene normalized relative to that of TcACP1 and TcβTub genes. G = globular, H = Heart, ET = Early Torpedo, LT = Late torpedo, EF = Early Full, LF = Late Full. Images for ZE-M, ZE-LF, ZE-EF and ZE-T were adapted from Maximova et al. [26].