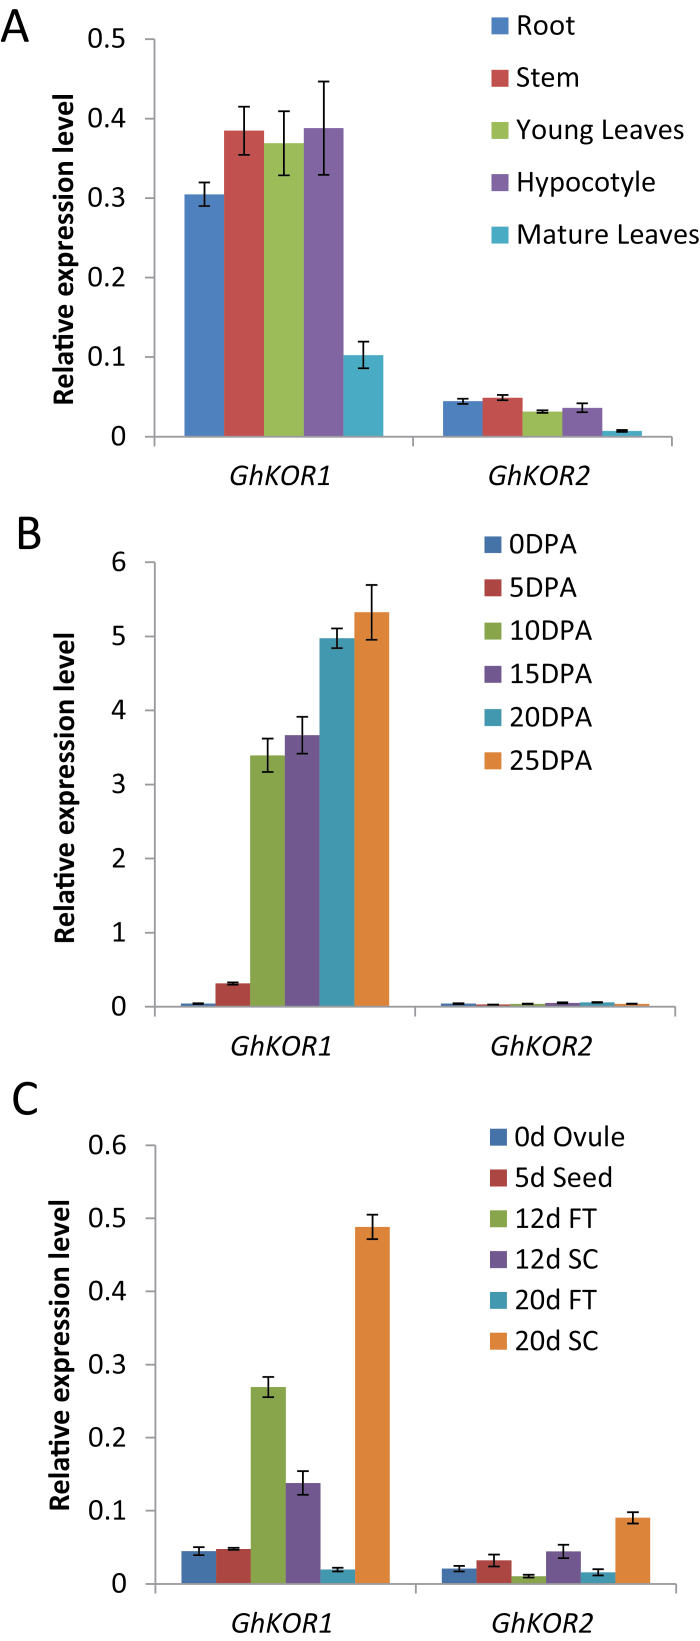
Fig. 1.
Transcript levels of GhKOR1 and GhKOR2 in wild-type cotton measured by qRT-PCR. (A) Transcript levels of GhKOR1 and GhKOR2 in root (R), stem (S), young leaves (YL), hypocotyls (H), and mature leaves (ML). (B) Transcript levels of GhKOR1 and GhKOR2 in 0, 5, 10, 15, 20 and 25 DPA fibre. (C) Transcript levels of GhKOR1 and GhKOR2 in 0 DPA ovule, 5 DPA seed, 10 DPA seed coat (SC) and filial tissue (FT), and 20 DPA seed coat (SC) and filial tissue (FT). (This figure is available in colour at JXB online.)

