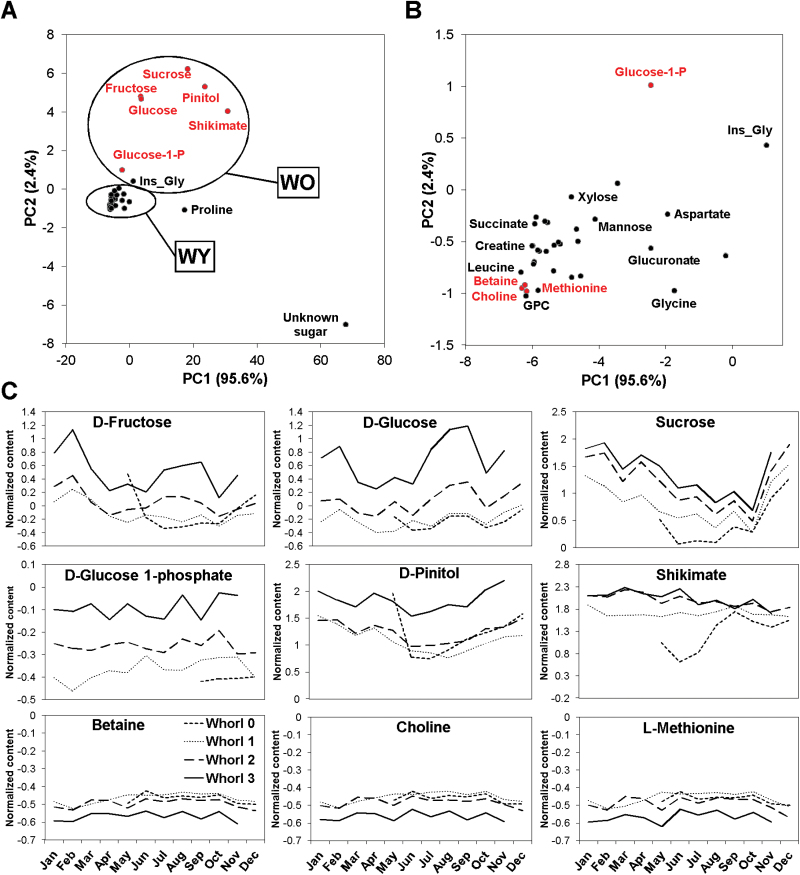
Fig. 2.
PCA of metabolite profiles. (A) PCA score plot of the identified metabolites. Principal components 1 and 2 explain 95.6 and 2.4% of the total detected variance, respectively, and reveal groups of metabolites that accumulate in older (WO) and younger (WY) whorls. (B) Detail of the WY metabolite area of the PCA plot. (C) Profiles of seven metabolites that accumulated in older whorls (D-fructose, D-glucose, sucrose, D-pinitol, shikimate, D-glucose-1-phosphate, and unknown_sugar), and three that accumulated in younger whorls (betaine, choline, and L-methionine), showing strong significant correlations with Whorl. Whorls 0, 1, 2, and 3 are represented by dashed, dotted, broken, and continuous lines, respectively. The data are means of six values from the NMR spectra. This figure is available in colour at JXB online.

