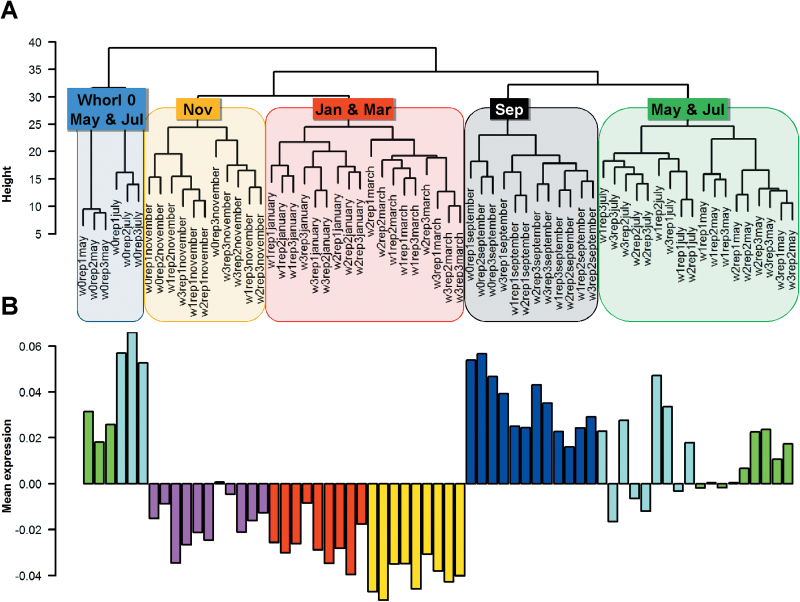
Fig. 3.
Hierarchical clustering and mean transcript levels in the needle RNA microarray samples. (A) Hierarchical clustering of the microarray samples. The coloured boxes show the harvesting time of each needle sample. The names of the samples (e.g. w0rep1may) indicate the whorl number (w0, Whorl 0), the biological replicate (rep1, individual 1), and the harvesting month. (B) Mean transcript abundance in each sample. Colour code for sampling month: red, January; yellow, March; green, May; light blue, July; dark blue, September; purple, November.

