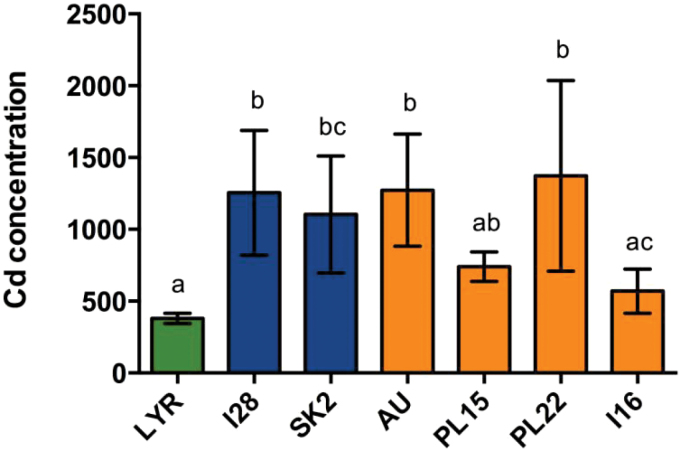
Fig. 3.
Cd concentration (μg –1) in shoots of NM (I28, SK2) and M (AU, PL15, PL22, I16) A. halleri populations and A. lyrata petraea (LYR) after a 3 week exposure to 5 μM CdSO4. Data are the mean ±SD, n= 7, 10, 4, 10, 11, 7, and 16, respectively; letters indicate significant differences at the 5% level. (This figure is available in colour at JXB online.)

