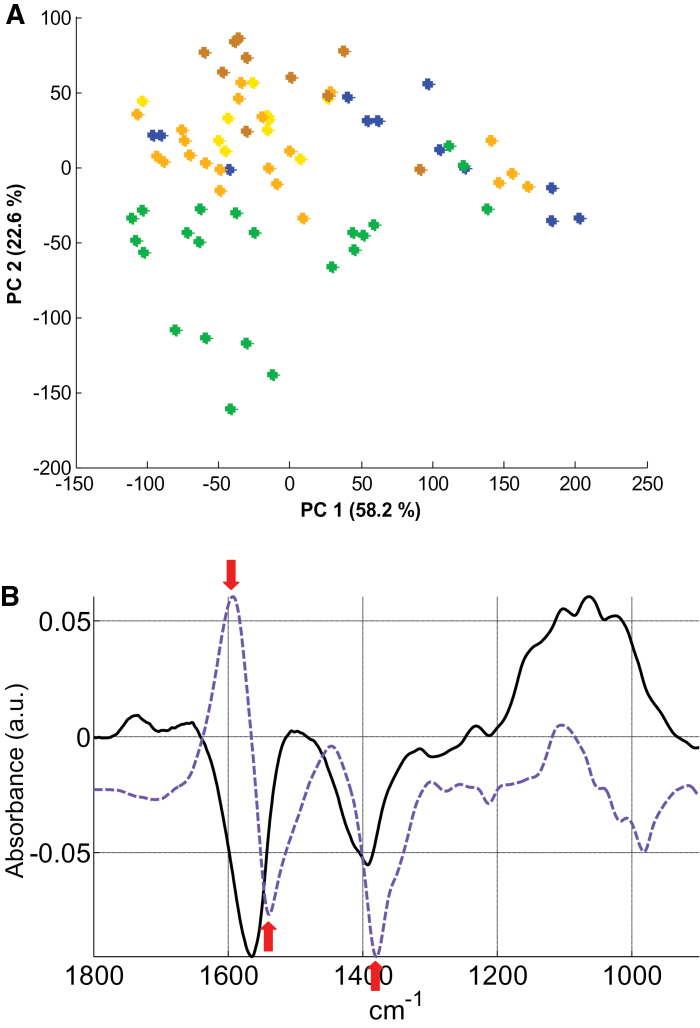
Fig. 5.
PCA analysis of FT-IR spectra obtained from all individuals in the NC condition (0 μM CdSO4). (A) Each dot is the projection of one spectrum on the first and second PCs. Green dots, A. lyrata petraea; blue dots, A. halleri NM population I28; from light to dark orange, A. halleri M populations AU, PL22, and I16. (B) Loading factor plots for PC1 (black line) and PC2 (blue line) explaining PCA clustering. Arrows point to the discussed wave numbers. Note that the curve of PC2 has been offset for better readability.

