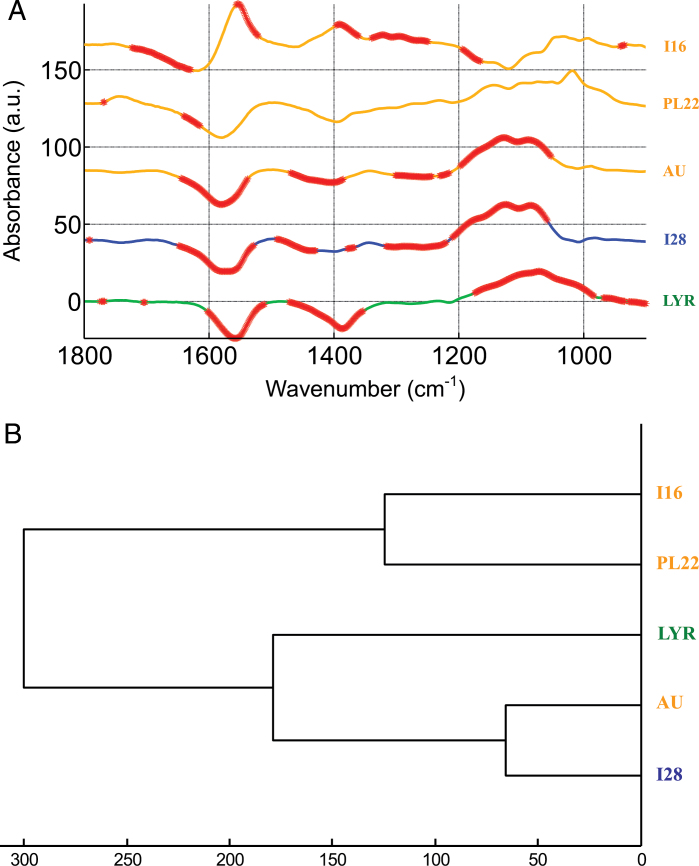
Fig. 7.
(A) Difference between the mean FT-IR spectra obtained at 0 and 5 μM CdSO4 for NM (I28) and M (AU, PL22, I16) A. halleri individuals and A. lyrata petraea (LYR). Student t-test was computed at every wave number with the significant level of 1%. Each marked wave number (thicker stars) indicates a statistically significant difference between treatments. Analysis was made on at least 12 FT-IR spectra per treatment and per population. Note that spectra have been offset for better readability. (B) Hierarchical classification of the difference spectra presented in (A). Classification was based on euclidian distances. (This figure is available in colour at JXB online.)

