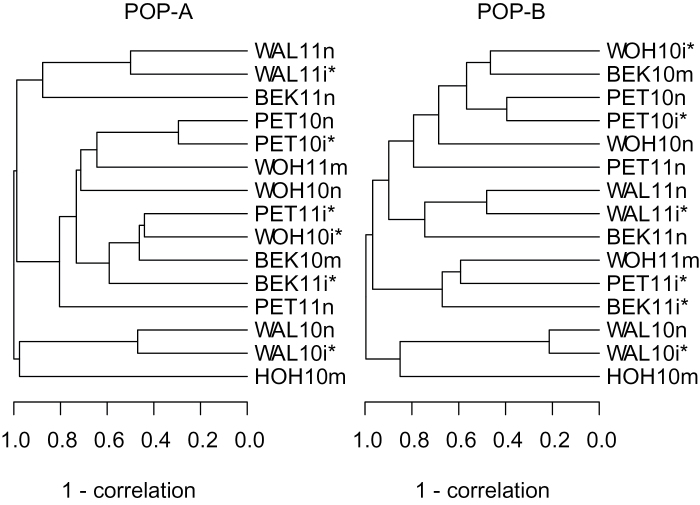
Fig. 1.
Dendrogram of cluster analysis including 15 environments (location × year × water availability) evaluated for grain yield for POP-A and POP-B. The cluster analysis is based on one minus the correlation coefficients among best linear unbiased estimates of single environments (for nomenclature of the environments see Material and methods). The asterisk denotes environments with severe drought stress leading to a reduction in average grain yield of more than 15%.

