
Fig. 2.
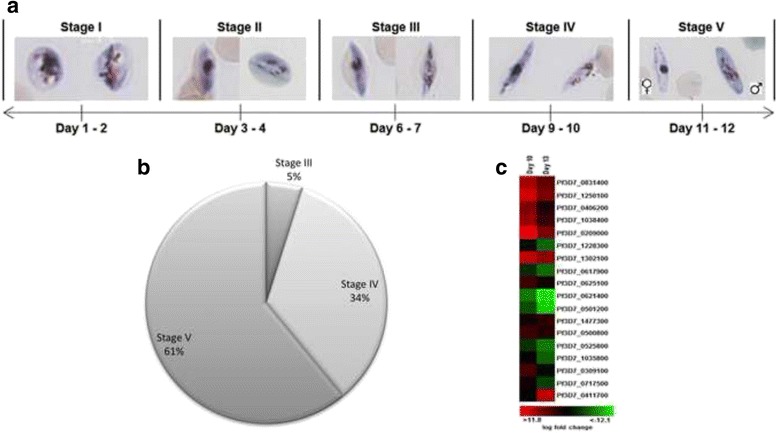
Stage-specific, quantitative analysis of gametocyte populations. a Giemsa-stained smears indicating morphology of different stages. b Stage distribution of gametocyte populations for 22 independent gametocyte cultures. c Semi-quantitative RT-PCR of stage-specific expression of 18 unique descriptors. PCR was performed and data normalized to cyclophillin as household expression control and expressed as fold change relative to background expression of the transcripts in asexual parasites. Data are from ≥4 independent biological experiments each performed in triplicate, from which expression ratios were determined. Under-expressed transcripts are presented in green and over-expressed transcripts in red