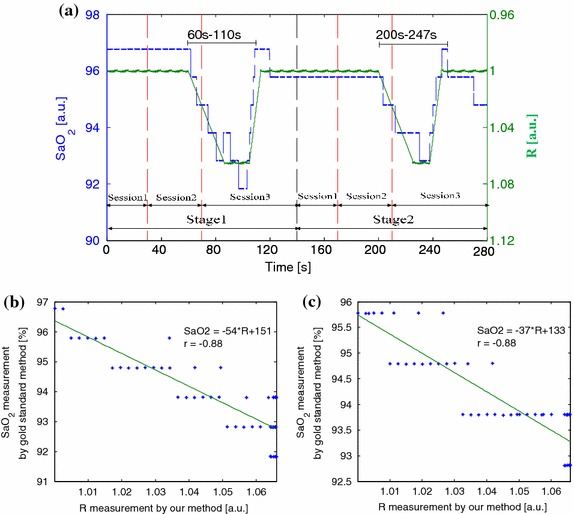
Figure 11.

a Comparison of R measured by the proposed method and SaO2 measured by the gold standard method in two stages from a male subject aged 30 years (S01 in Table 1). b A correlation analysis and linear regression line for SaO2 and R from 60 to 110 s of the first stage. c A correlation analysis and linear regression line for SaO2 and R from 200 to 247 s of the second stage.
