
Fig. 1.
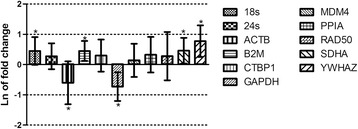
Mean and standard error of the natural log of RNA expression in untreated blood mononuclear cells at 24 h relative to 4 h of culture. * Shows the mean is significantly (P ≤ 0.05) different than zero based on T-distribution test (Forthofer R. Biostatistics, pp 229), and that these genes significantly vary due to culturing time without treatment. Genes symbols were described in materials and methods