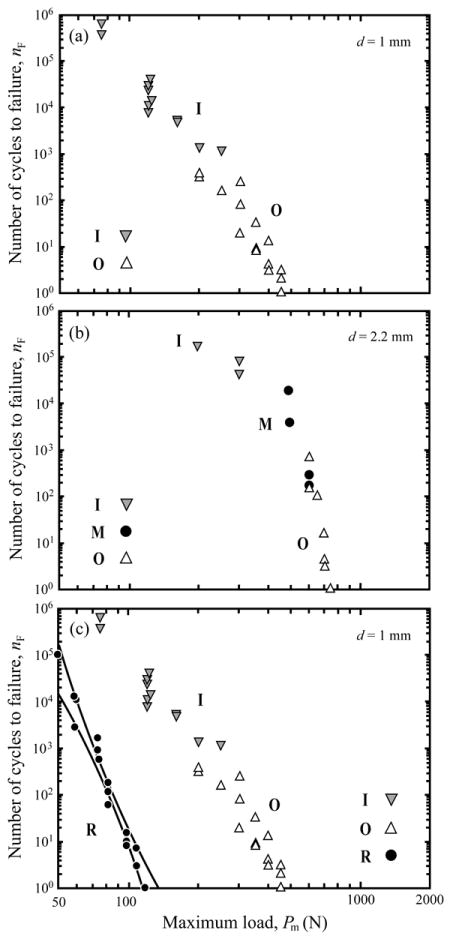
Figure 6.

Number of cycles to failure nF as function of maximum contact load Pm for soda-lime glass/polycarbonate bilayers. Glass thickness (a) d = 1 mm, (b) d = 2.2 mm, and (c) d = 1 mm. In (a) and (b), the top, occlusal surface of glass layer is lightly abraded with 600 grit SiC particles, while the bottom, internal surface of glass is etched with HF. Note failure from different crack modes at different Pm. In (c), the top surface of glass is abraded, while the bottom surface is sandblasted with 50 μm alumina particles. Note the dominance of cementation internal surface radial (R) fracture in (c). Note: O, outer cone cracks; I, inner cone cracks; M, median cracks; R, radial cracks. Lines represent 95% confidence bounds to the radial crack initiation data.
