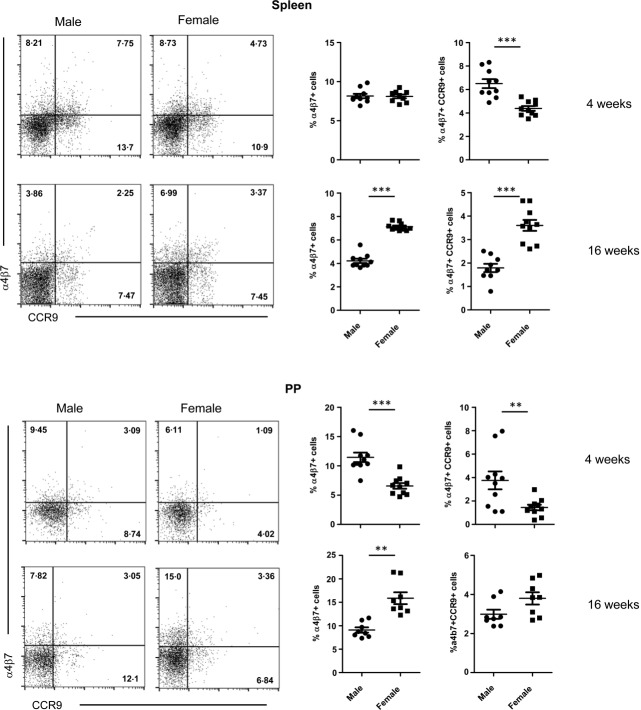
Fig 3.
Gut-associated T cells in male and female SWR × NZB F1 (SNF1) mice. Spleen and Peyer's patches of 4- and 16-week-old male and female SNF1 mice were examined for CD4, α4β7 and CCR9 expression by fluorescence activated cell sorter (FACS). Representative FACS plots for male and female (left panels) and mean ± standard error of the mean of percentage values of α4β7 single-positive or α4β7 and CCR9 double-positive cells (right panels) are shown.

