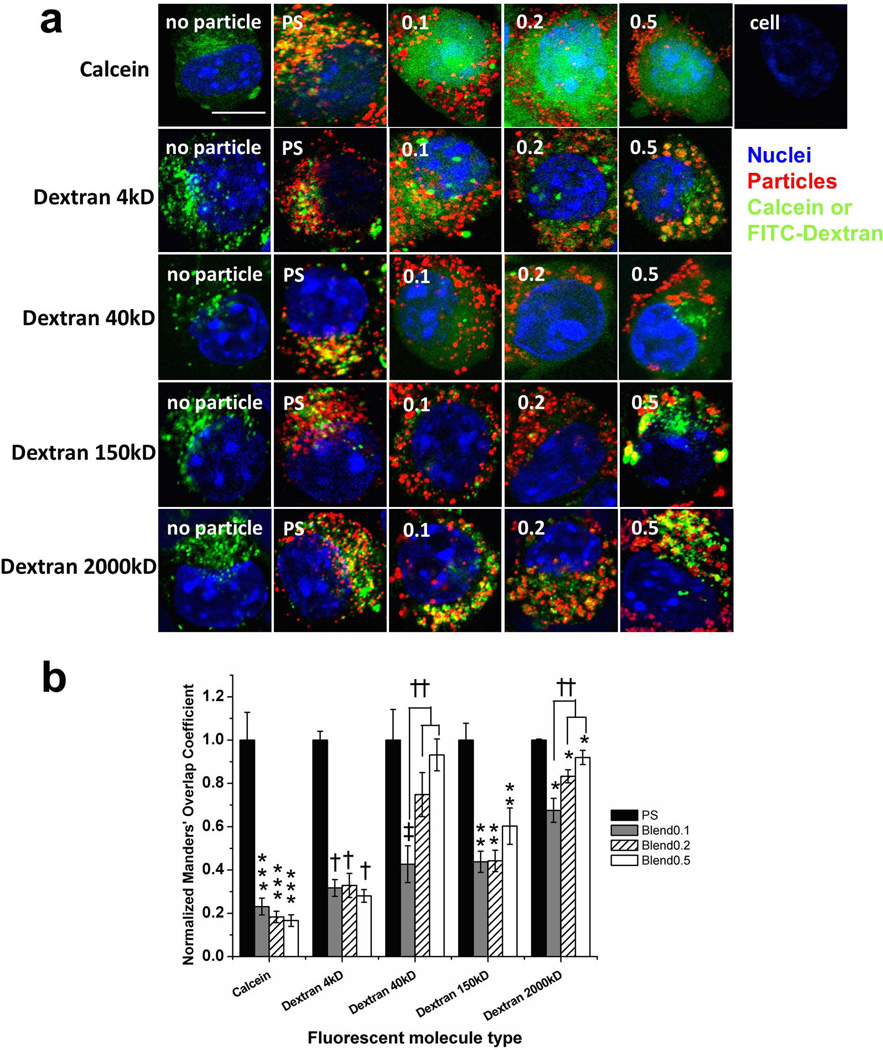
Fig 4. Confocal microscopic analysis of the intracellular distribution of calcein and FITC-dextran with different molecular weights (4, 40, 150 and 2,000 k Da) in DC2.4 cells.
Calcein and FITC-dextran molecules were co-delivered with blend particles or PS particles (a). 4 h later, cells were washed and fixed for confocoal microscopic analysis. PS represents the carboxylate-modified polystyrene beads (200 nm). Blue: nucleus, green: calcein or FITC-dextran, red: particles. Scale bar = 10 µm. The images are representative of two independent experiments. Three to five regions for each sample were taken by confocal microscopy at 63 × oil immersion. Manders' coefficient of fluorecent cargo for different types of particles (b). ImageJ and a plug-in JACoB were utilized for computing co-localization coefficients (Manders’). Fifteen cells for each group were chosen and the Manders’ coefficient of fluorescent cargo was plotted. The values are mean ± S.E, and normalized to the value of polystyrene particle (PS) in each fluorescent cargo group. Asterisks, double asterisks, triple asterisks, daggesr and double daggers indicate p < 0.05 respect to the each PS sample.

