
Figure 9. Dicer1 mutation results in loss of stromal cell microRNA that serve to promote human renal stromal cell migration, proliferation and expression of factors.
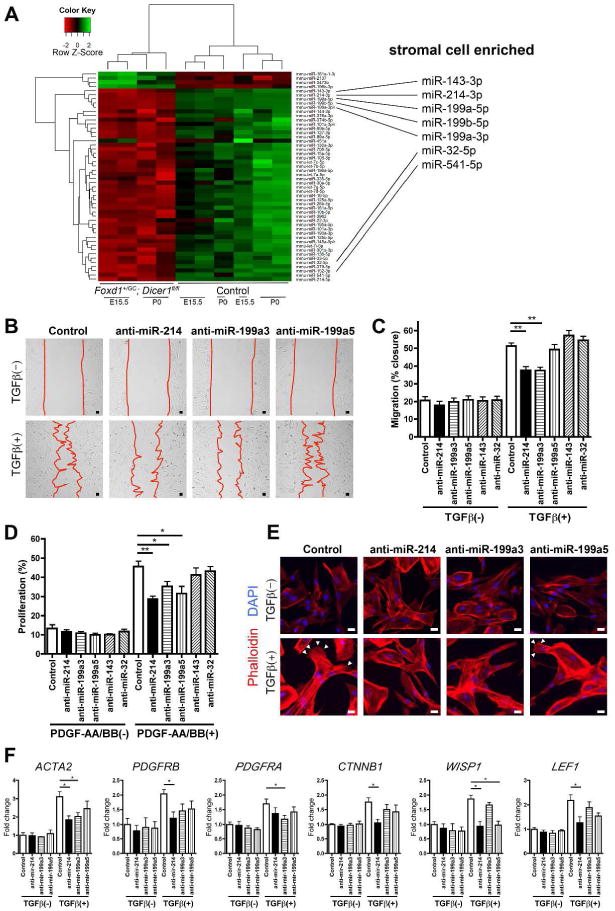
(A) Heatmap showing hierarchical cluster analysis of significantly differentially regulated microRNA between control, Foxd1+/GC; Dicer1fl/fl, E15.5 and P0 kidneys. Mutant kidneys cluster together and show 46 miRNA with reduced expression compared with 4 which were increased. When these miRNA were interrogated against miRNA that are enriched in stromal cells 7 miRNA were identified (right panel). (B) Photomicrographs showing effect of anti-miR-214 and -199a-3p on migration. (C) Graph showing the effect of different anti-miRNAs on migration when stimulated by TGFβ after 24h. (D) Graph showing the effect of different anti-miRNAs on proliferation when stimulated by a combination of PDGF-AA and -BB after 16h. (E) Images of phalloidin-Cy3 stained stromal cells showing the formation of lamellipodia and filopodia in response to TGFβ at 24h (arrowheads), a response markedly diminished following silencing of miR-214 or miR-199-3p (F) Graphs showing the effect of anti-miR treatment on transcript levels. Bar, 25 μm. *P < 0.05, **P < 0.01. n = 3–5/group