
Figure 2.
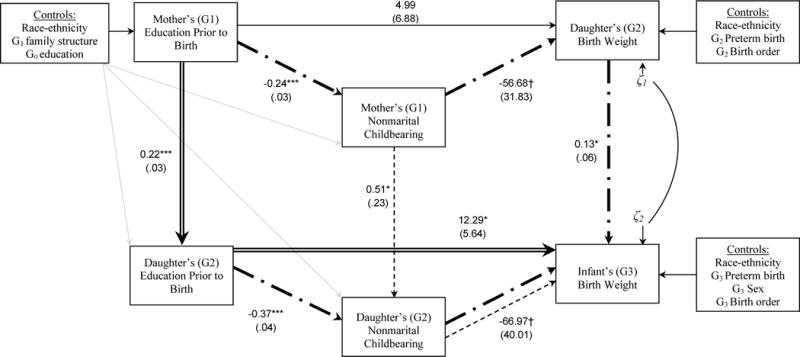
Structural Equation Model Results for the Integrative Inter- and Intra-generational Model of Growth Restriction, Education, and Nonmarital Childbearing
Notes: N = 1,580 mother (G1) — daughter (G2) pairs. Double, dash, and dash-dot lines indicate statistically significant indirect pathways (p < .10 level or better).
Source: National Longitudinal Survey of Youth 1979 cohort (NLSY79) and Children of the NLSY79.