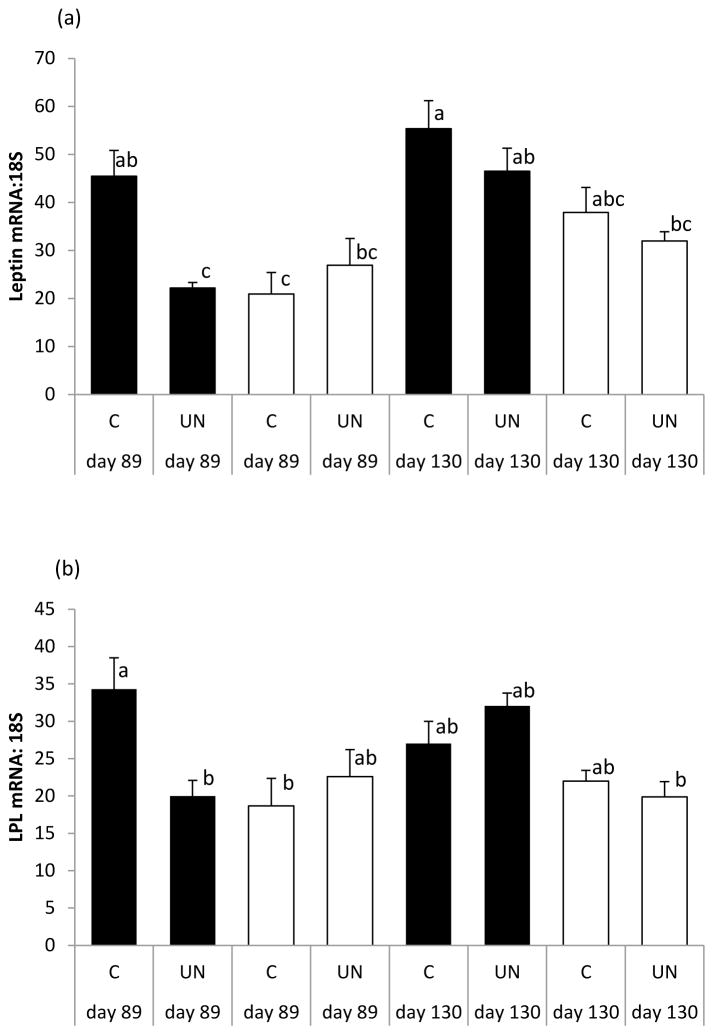
Figure 2.
Relative leptin (a) and LPL (b) mRNA expression in fetal perirenal fat of female (solid bar) and male (open bar) fetuses from control (C) and undernourished (UN) adolescent dams whose pregnancies were terminated on day 89 or day 130 of gestation. ANOVA was used to determine effects of sex, maternal nutrition, stage of gestation, and all possible interactions. Vertical bars are group mean ± sem and those with different letters differ P<0.05 using Tukey’s post-hoc method. Number of fetuses per group can be derived from Table 3. For leptin, there were effects of gender (P=0.001), stage of gestation (P=0.001), nutrition (P=0.029) and a gender x nutrition interaction (P=0.029). For LPL, there was an effect of gender (P=0.002), and a gender x nutrition x stage of gestation interaction (P=0.008).

