Figure 1.
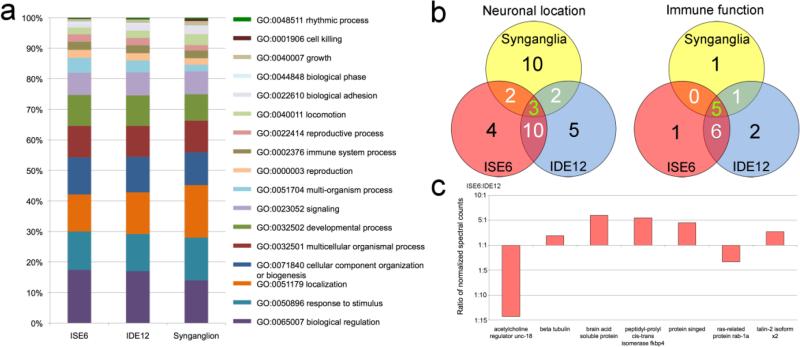
Characterization of unique and shared proteins with specialized function in I. scapularis synganglia, ISE6, and IDE12 cells. a) Representation of the proportion of level 2 GO terms associated with the proteins identified in the 3 cell and tissue samples. The three most common level 2 GO terms, metabolic process (GO:0008152), cellular process (GO:0009987), and single-organism process (GO:0044699), which represent 50-55% of annotated terms have been excluded to allow greater resolution amongst the rarer terms. b) Number of unique and shared neuronal and immune proteins by sample set. The green number in the center of the Venn diagram represents the number of proteins common to all sample sets. White numbers in overlapping regions represent proteins shared by two sample sets, and the black numbers represents unique proteins. Details are in Supplemental Table S1. c) Relative abundance of significantly different neuronal proteins shared between the ISE6 and IDE12 cells. The relative abundance was determined by the normalized count of the spectra used to identify each of the proteins.

