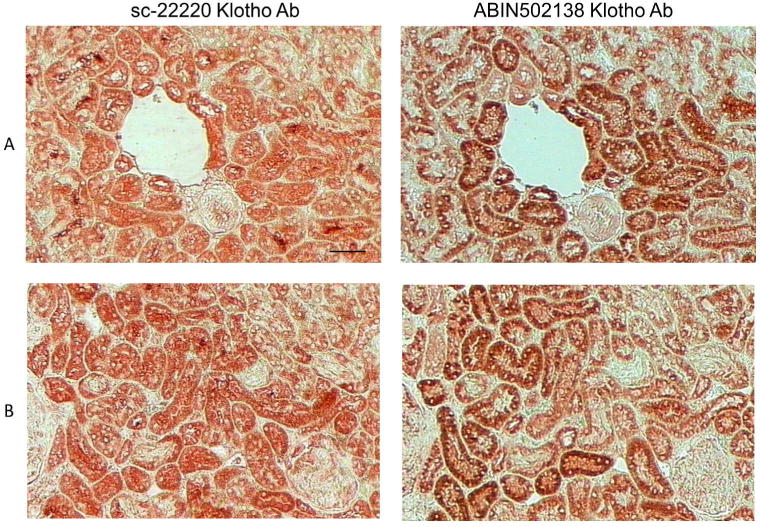
Figure 10.

Comparison of Immunostaining of 2 Klotho Antibodies in Rat Kidney. Representative images of H&E staining and Klotho immunostaining using 2 different antibodies on consecutive sections of cortical rat kidney tissue, 200x; bar represents 50 microns and applies to all figures. Staining of the tubules in the cortical areas of the sections was comparable with the 2 antibodies.
