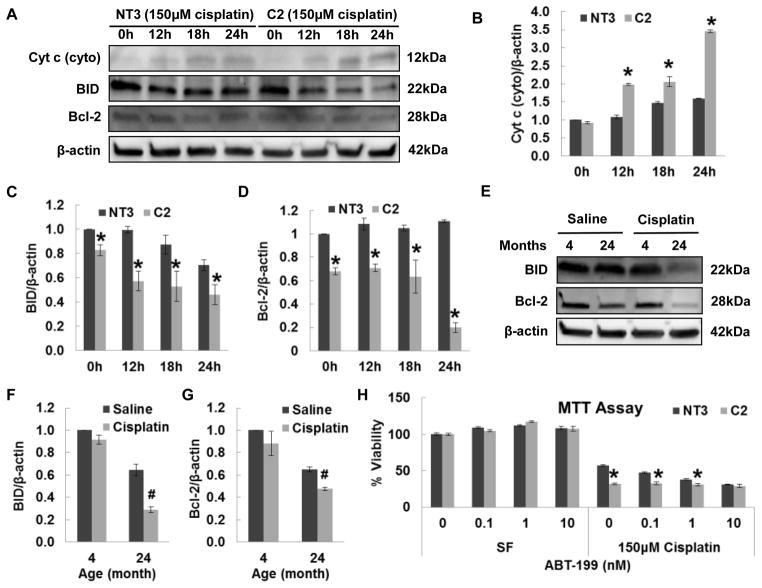
Fig. 5. The role of mitochondria in cisplatin induced injury in NT3 and C2 cells.
Immunoblot analysis (A) and quantification of cytosolic cytochrome c (B), BID (C) and Bcl-2 (D) in whole cell lysates obtained from cells treated with 150 μM cisplatin for indicated time periods (N=2). The β-actin blot serves as the loading control. Immunoblot (E) and quantification of BID (F) and Bcl-2 (G) in kidney tissue lysates obtained from 4- and 24-months-old rats at 72 h after saline or 2.75 mg/kg cisplatin IP injection. The pound indicates the significant difference between saline and cisplatin treated group (N=5). (H) Cell viability determined by MTT assay in cells treated with indicated concentrations of ABT-199 alone or in the presence of 150 μM cisplatin for 24 h (N=3). The asterisks indicate the significant differences between NT3 and C2 cells.

