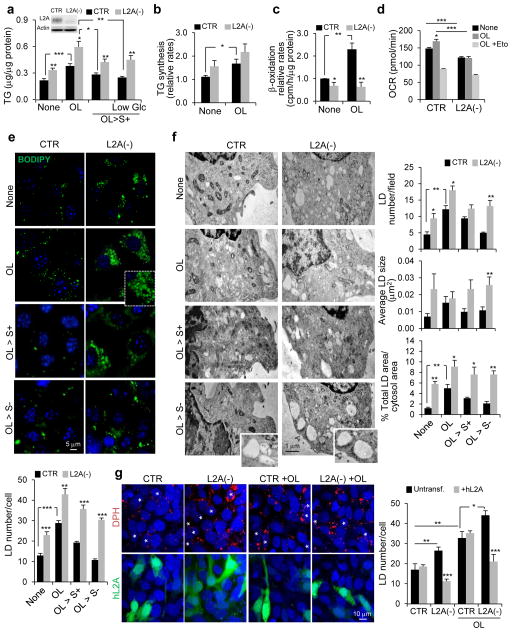
Figure 1.
LAMP-2A-deficient cells accumulate LD. (a) Total triglycerides (TG) in control mouse fibroblasts (CTR) and in cells stably knocked down for LAMP-2A (L2A(−)) (inset) untreated or treated with OL, incubated with serum-supplemented regular media (OL>S+) or low glucose media (OL>S+ Low Glc) after OL treatment. n=4 (LowGlc), 6 (OL>S+) and 7 (all other conditions) independent experiments. (b) TG synthesis in cells as in (a). n=4 independent experiments. (c) Beta-oxidation rates in cells as in (a). n=6 independent experiments. (d) Oxygen consumption rates (OCR) in CTR and L2A(−) cells with the indicated treatments. Eto: etomoxir. n=5 time points from 8 independent experiments. (e) BODIPY493/503 staining in CTR and L2A(−) cells untreated or treated with OL, or incubated with serum-supplemented medium (OL>S+) or serum-deprived medium (OL>S−) after OL treatment. Graph: average LD number/cell (LD size shown in Supplementary Figure 1d). n=6 independent experiments with 40 cells per condition in each experiment. (f) Electron microscopy of cells treated as in (e). Graphs: area occupied by LD or average LD number/cell and LD size. n=3 independent experiments with 5 micrographs per condition. (g) DPH staining in CTR and L2A(−) cells transfected with hL2A, untreated or treated with OL. Asterisks: transfected cells. Graph: average LD number/cell calculated from orthoviews. n=5 independent experiments with 40 cells per condition in each experiment. Values are mean ± SEM. Differences are significant for *P<0.05, **P<0.01, ***P<0.001 using Student’s t-test. Source data is available in Supplementary Table 1.

