Table 1.
Structure and antimalarial activity of selected quinolones.

| ||||||
|---|---|---|---|---|---|---|
| Compound | Structure | EC50a (μM) | ||||
| Nucleus | R1 | X6 | R2 | Y | ||
| Clinafloxacin | A |
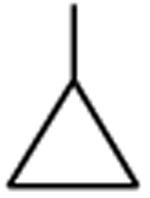
|
C-F |

|
C-Cl | 3.2 |
| Ciprofloxacin | A |
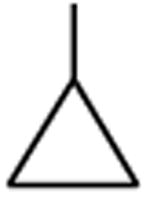
|
C-F |
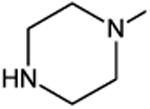
|
C-H | 5.6 |
| Gatifloxacin | A |
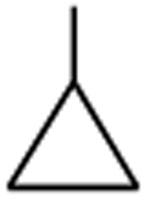
|
C-F |

|
C-O-CH3 | 12 |
| Norfloxacin | A | -C2H5 | C-F |
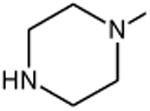
|
C-H | 14 |
| Pefloxacin | A | -C2H5 | C-F |

|
C-H | 23 |
| Levofloxacin | B | -(S)CH3 | C-F |

|
-- | 30 |
| Ofloxacin | B | -(R,S)CH3 | C-F |

|
-- | 30 |
| Oxolinic Acid | A | -C2H5 | C-O-CH2-O- | C-H | 68 | |
| Piromidic Acid | A | -C2H5 | N |
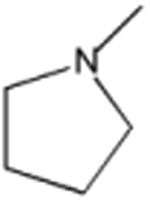
|
N | 80 |
| Fleroxacin | A | -CH2CH2F | C-F |

|
C-F | 90 |
| Nalidixic Acid | A | -C2H5 | C-H | -CH3 | N | 240 |
For each set of quadruplicates the coefficient of variation averaged ≤ 10% with a maximum of 34%. R2 values for the fitted curves were ≥ 0.99. The EC50 of positive control artemisinin, assayed concurrently with the quinolones, was 8.6 ± 1.1 nM (8 determinations).
