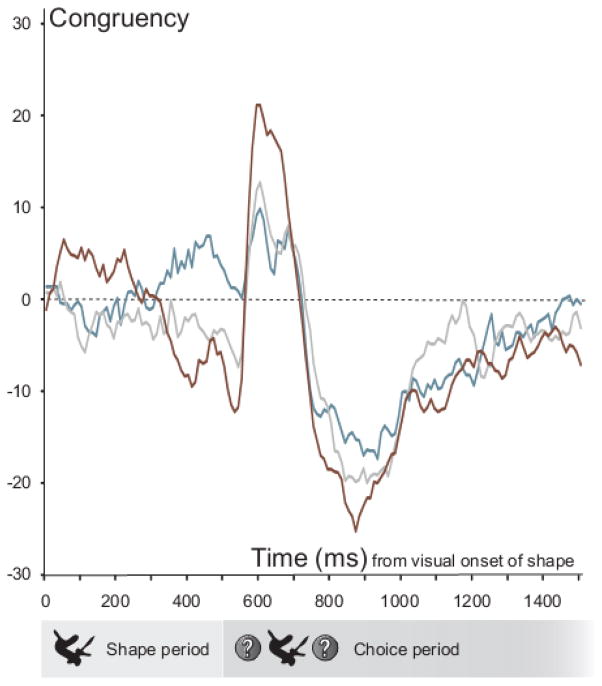
Figure 5. Congruency of the neural population responses across a trial of the active shape-saccade association task.
The mean congruency scores at each time after the visual onset of shape are shown for early novel (blue), late novel (gray), and familiar (brown) shape trials. A positive congruency score signifies that the firing rate was in general higher during PREF shape trials than ANTI shape trials, while a negative score indicates the opposite.

