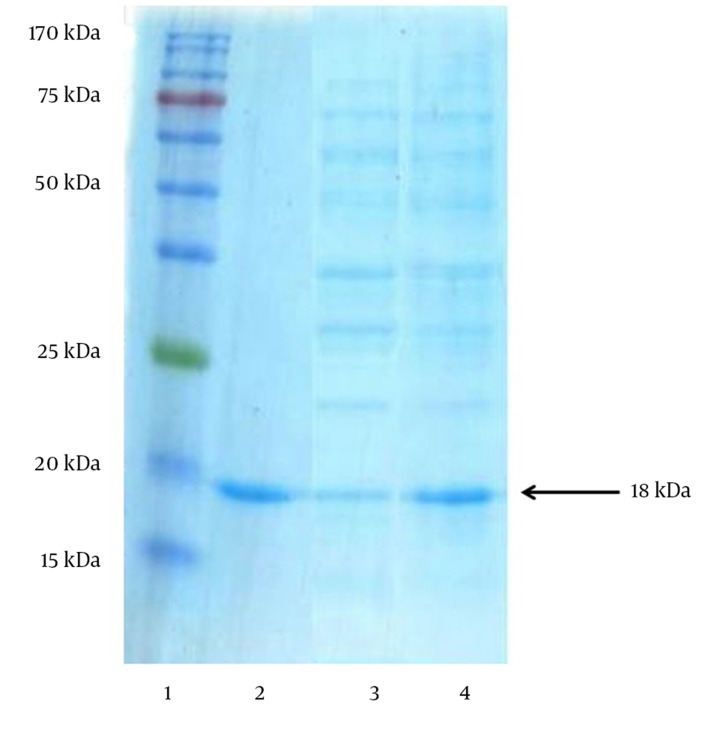
Figure 4. Visualization of the Increased Periplasmic rhIFN-β-1b Overexpression Yield in Escherichia. coli After the Optimization Study Using SDS–PAGE (17.5%) Analysis.
Lane 1: Chromatine prestained protein ladder (SinaClon, Tehran, Iran), Lane 2: rhIFN-β as positive control (ZiferonTM, Zist Daru Danesh, Tehran, Iran), Lane 3: Cell lysates from nonoptimized conditions (consisted of 5 g L-1 glucose, OD600 nm prior induction 3.5 and induction temperature of 37°C) and Lane 4: Optimized conditions (consisted of 7.81 g L-1 glucose, OD600 nm prior induction 1.66 and induction temperature of 30.27°C). The additional band with molecular weight of 18 kDa in periplasmic fraction after induction corresponds to rhINFIFN-β. The arrow indicates the position of rhIFN-β-1b.

