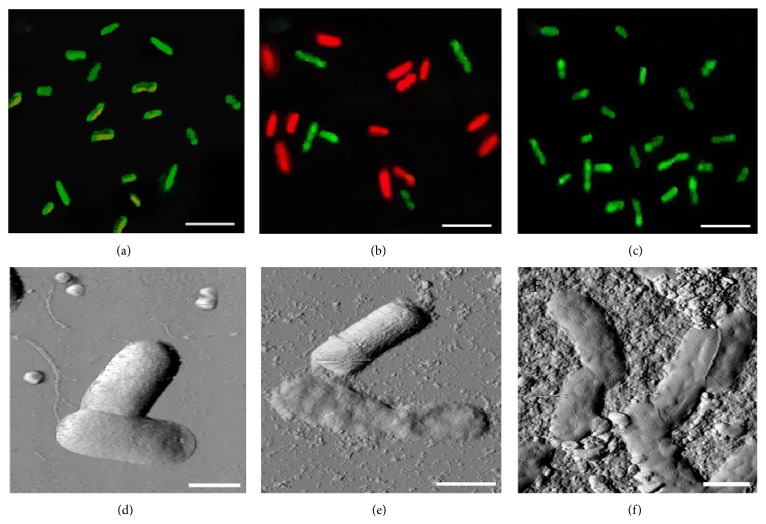
Figure 6.
Fluorescent microscopy images ((a)–(c)) and atomic force microscopy images ((d)–(f)) of E. coli K12 TG1 cells treated with graphene shells suspension at 10−3 mg/L for 180 min ((a), (d)) and graphene oxide suspension at 1.25 × 10⁻⁴ mg/L for 180 min ((b), (e)) and placed on the surface of graphene oxide paper for 60 min ((c), (f)). Scale bar: 5 μm ((a)–(c)); 1 μm ((d)–(f)).

