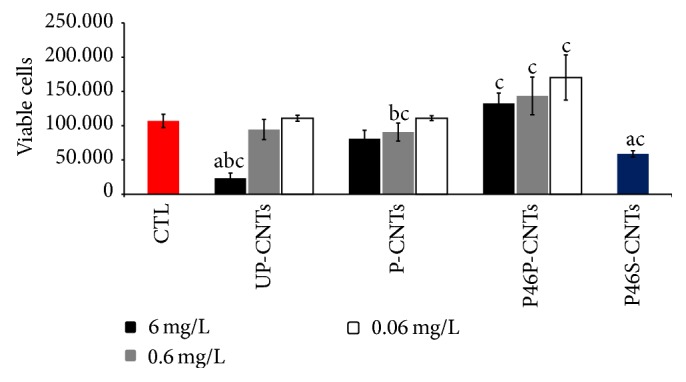
Figure 3.

Viability of MOs exposed to different CNTs for 24 h. Each bar represents mean ± SD of two experiments in triplicate (n = 6). a, P < 0.01 denotes significant differences between mean values measured in the indicated group compared to the control without stimulus (CTL); b, P < 0.01 denotes significant differences between mean values for CNTs at different concentrations; c, P < 0.01 denotes significant differences between mean values for a particular concentration among different CNTs.
