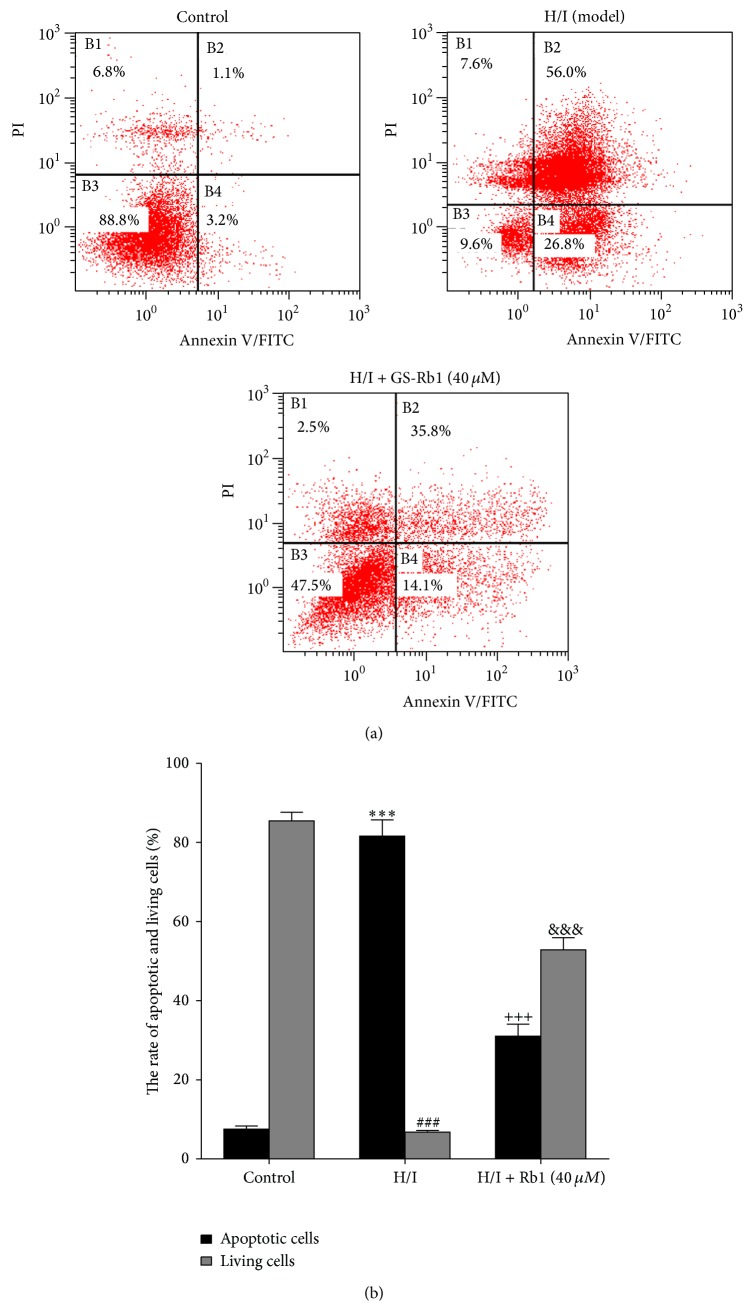
Figure 2.
Flow cytometry analysis of GS-Rb1 on cell death induced by H/I. (a) NRCMs were cotreated with or without GS-Rb1 (40 μM) during H/I for 12 h and stained with Annexin V-FITC/PI. (b) Quantification of the percent of apoptotic and living cells in each group. Error bars represent mean ± SD. *** P < 0.001 versus apoptotic cells in control group; ### P < 0.001 versus living cells in control group; +++ P < 0.001 versus apoptotic cells in H/I group; &&& P < 0.001 versus living cells in H/I group (n = 3).

