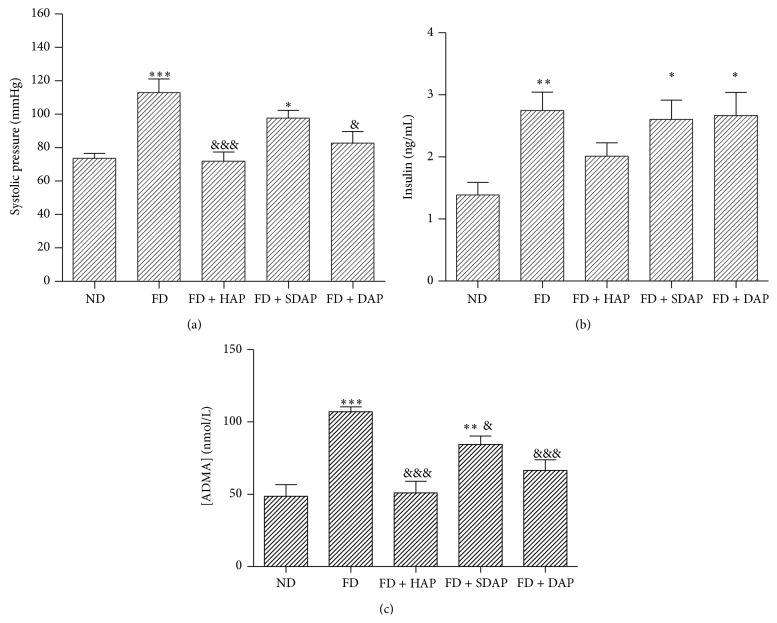
Figure 1.
(a) Systolic blood pressure of mice subjected to different diets. ND, normal diet; FD, fat diet; HAP, healthy apple peel; SDAP, sun damaged apple peel; DAP, dehydrated apple peel. Statistical significance: ∗ P < 0.05, ∗∗∗ P < 0.001 versus normal diet. Statistical significance: & P < 0.05, &&& P < 0.001 versus fat diet. All groups have a minimum of 4 mice. (b) Average insulinemia in mice fed with different diets. Statistical significance: ∗ P < 0.05, ∗∗ P < 0.01 versus normal diet. Statistical significance: & P < 0.05 versus fat diet. All groups have a minimum of 4 individuals. (c) Serum ADMA of mice fed with different diets. ∗∗ P < 0.01, ∗∗∗ P < 0.001 versus normal diet. Statistical significance: & P < 0.05 versus fat diet. All groups have a minimum of 4 individuals.

