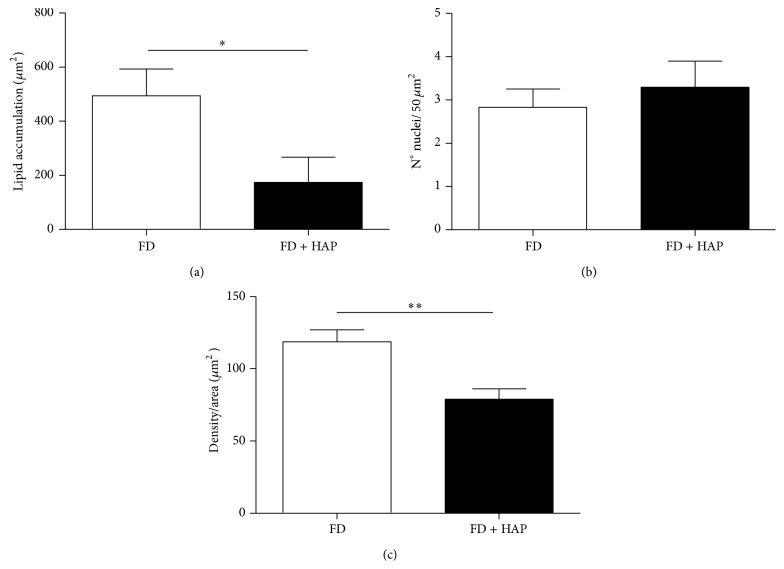
Figure 3.
Image analysis of atherosclerotic lesions in ApoE−/− mice. (a) shows the area of cholesterol expressed as μm2 of the lesion. In (b), the degree of infiltration expressed as number of cores in the lesion is shown. (c) illustrates the degree of infiltration expressed by the color intensity of the area. Statistical significance: ∗ P < 0.05, ∗∗ P < 0.01 versus fat diet.

